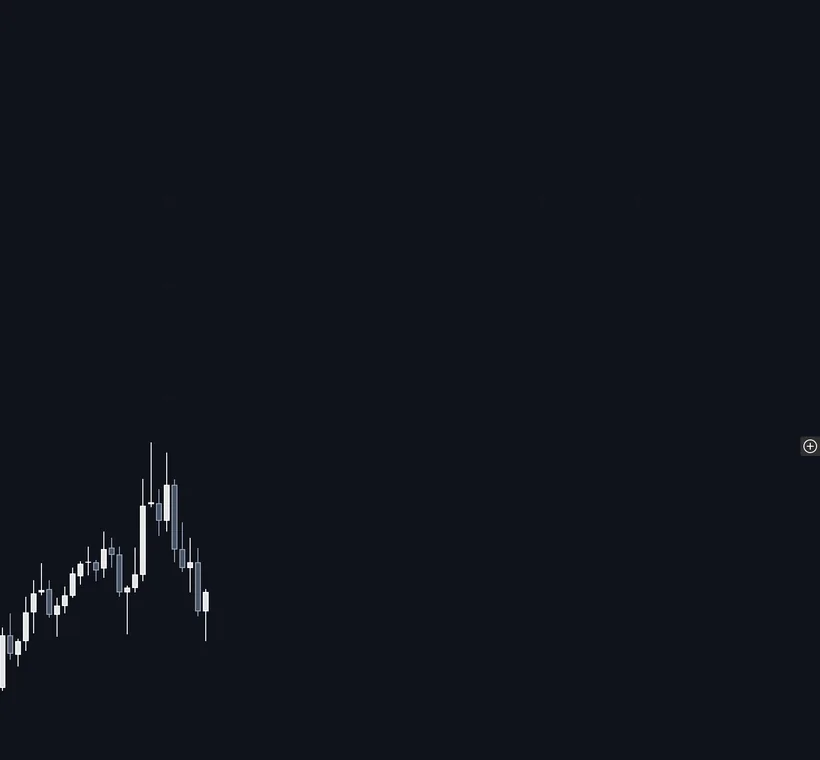
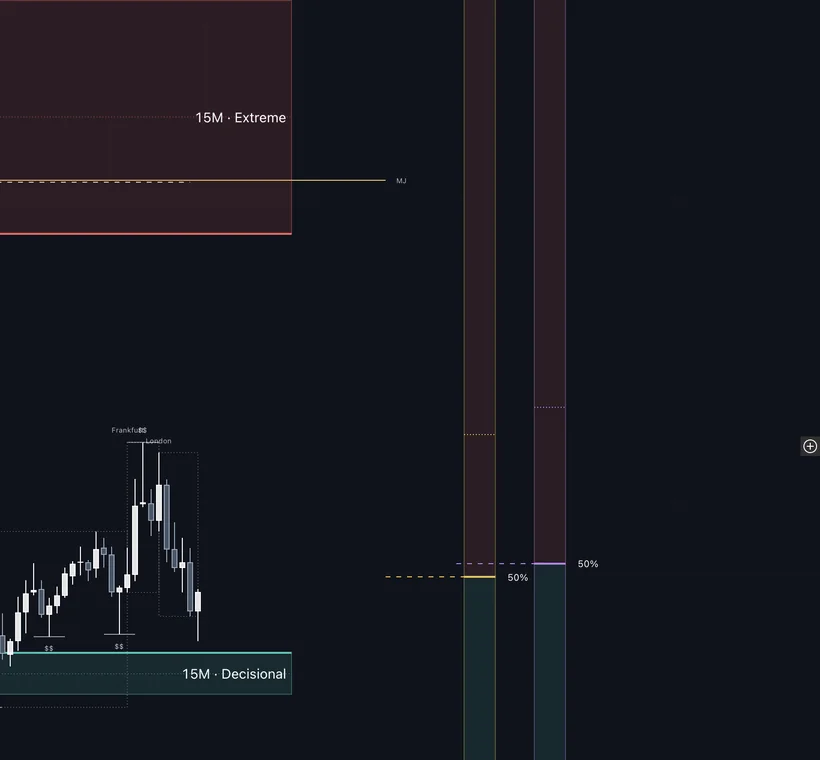
Same chart. Nothing on it.
Scroll: turn the Layer on one module at a time, then replay what price did next.
HTFLiquidityStructureZonesTargets
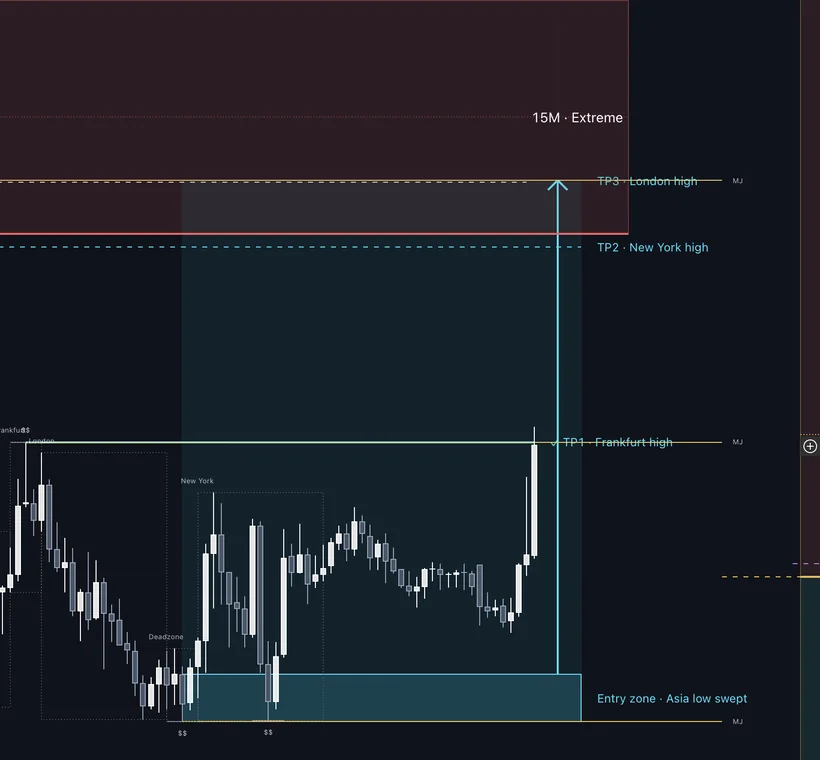
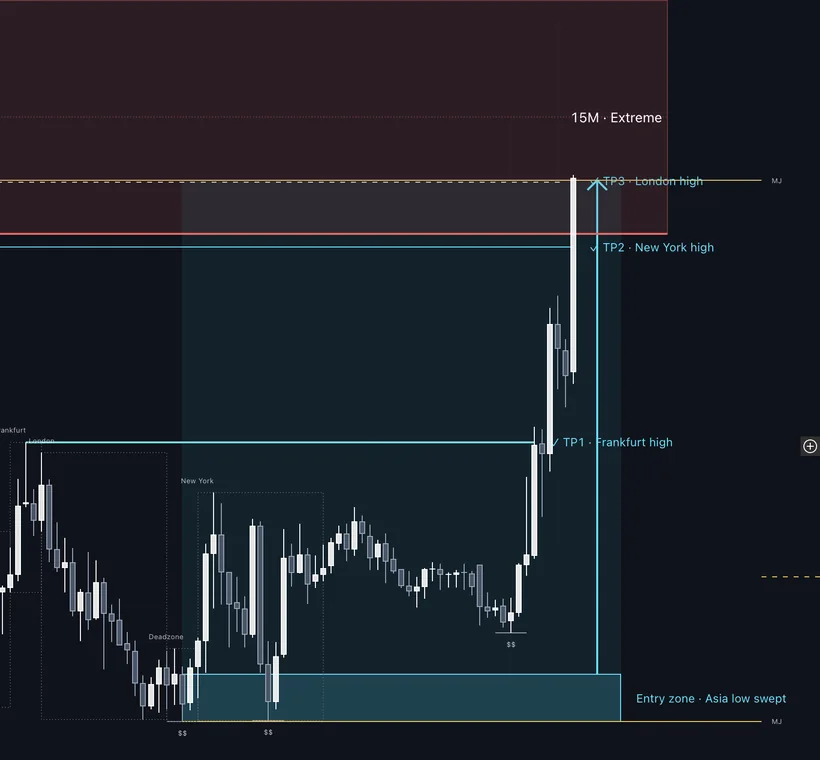
↓
Nexus Layer · for TradingView
Higher timeframe, liquidity, structure, zones and targets. One screen, on your chart.
Scroll. Watch it play out ↓
01 · Market structure
Start from the higher timeframe.
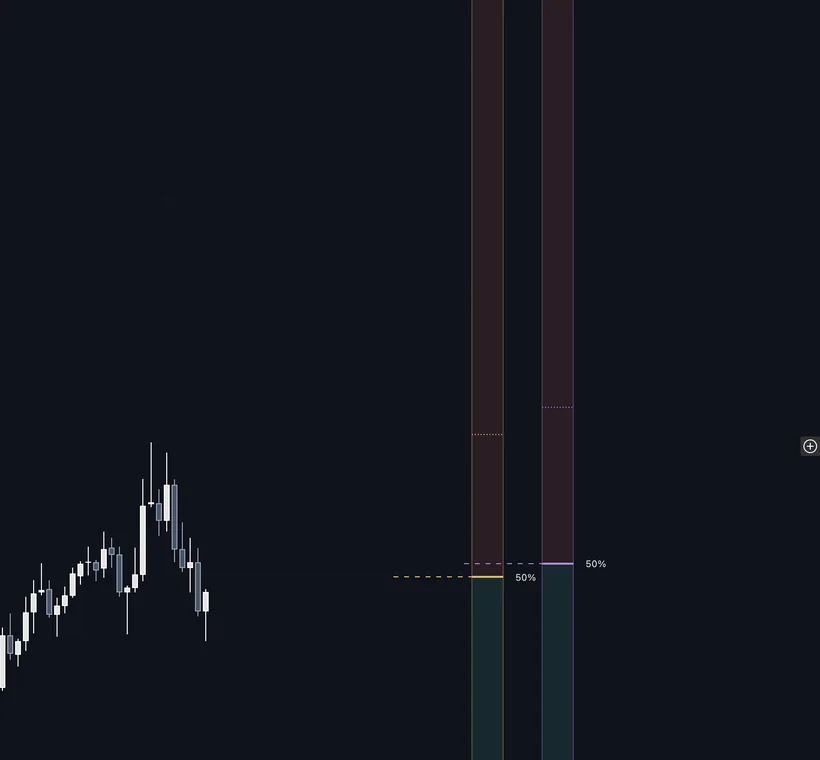
Daily and 4H were bearish. A rally against them is a test, not a new trend.
02 · Price expectation
Price ran into the upper half of the range.
In a falling market, that's where selling makes sense. Buying up there is the weak side.
03 · Sessions
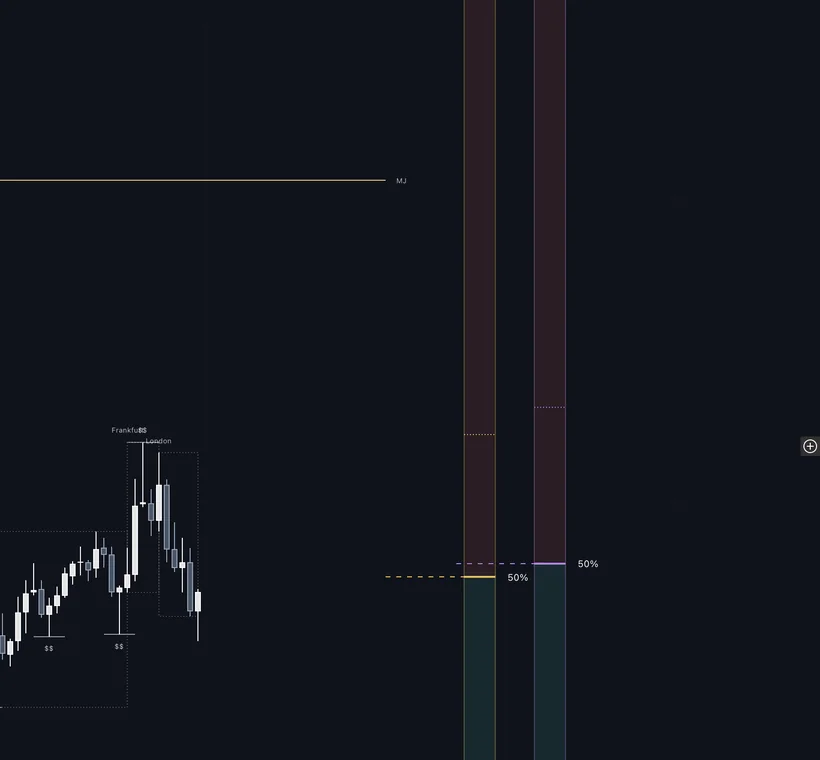
Asia and Frankfurt left highs. London ran them.
The orders above were filled. The breakout's fuel ran out.
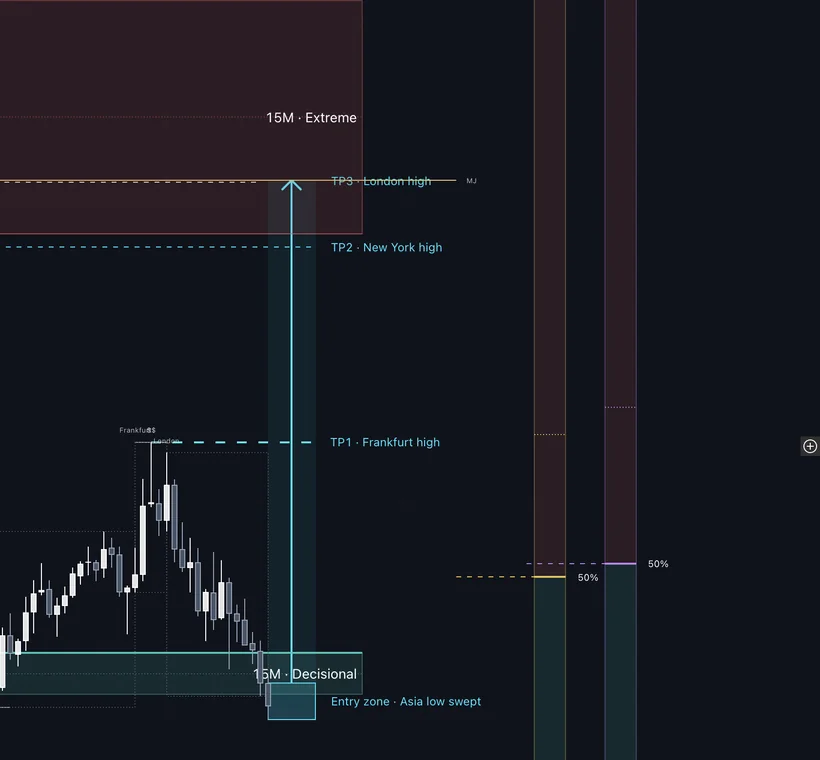
04 · Mid timeframe confirmation
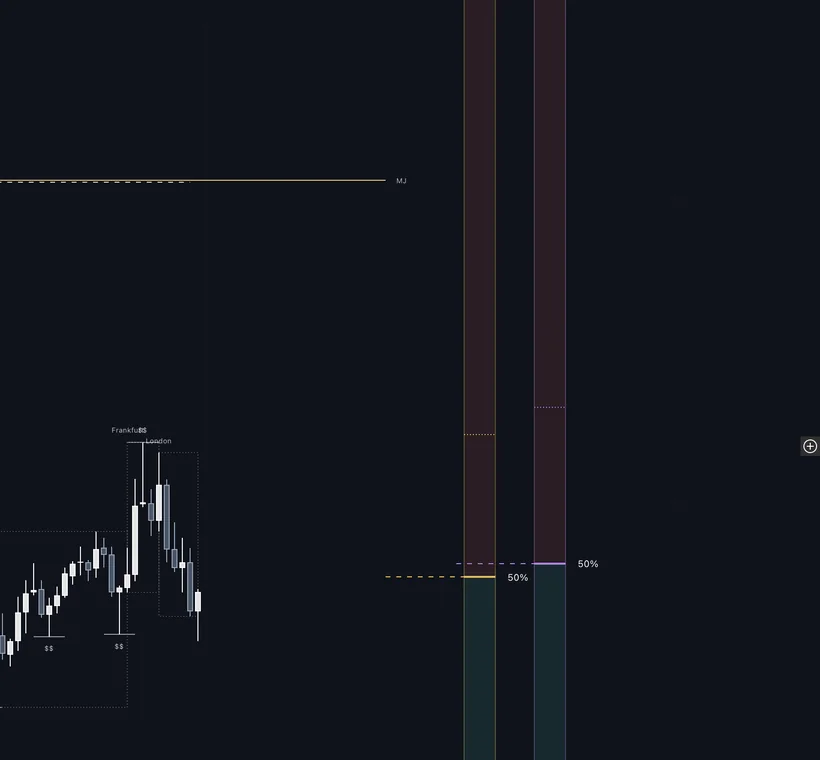
Structure turns down.
The last higher low gives way. The mid timeframe now agrees with the higher one.
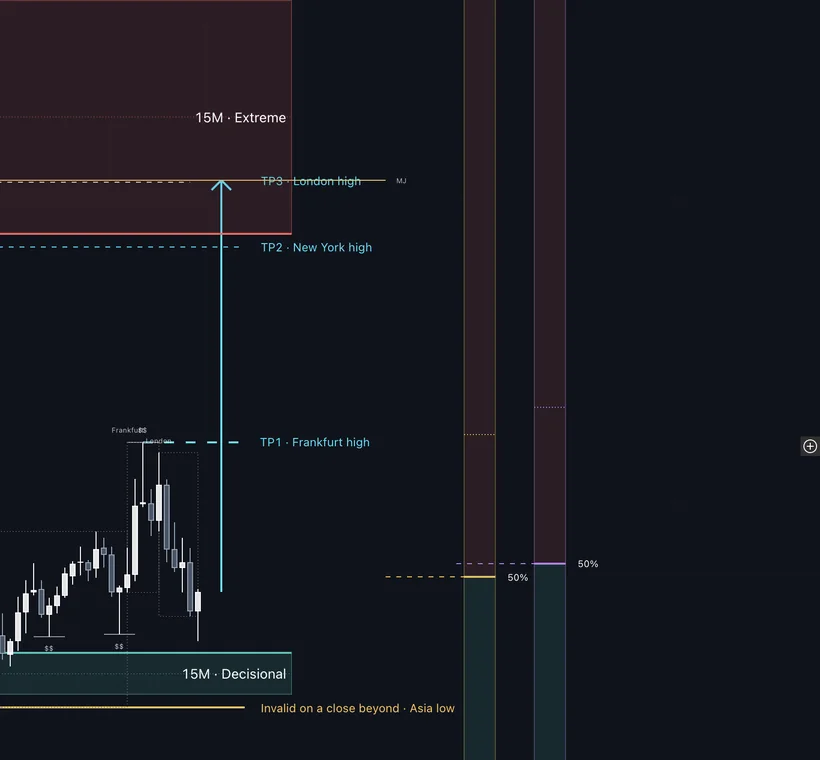
05 · Target
The other side of the range.
Session lows and the range low, where the next orders sit.
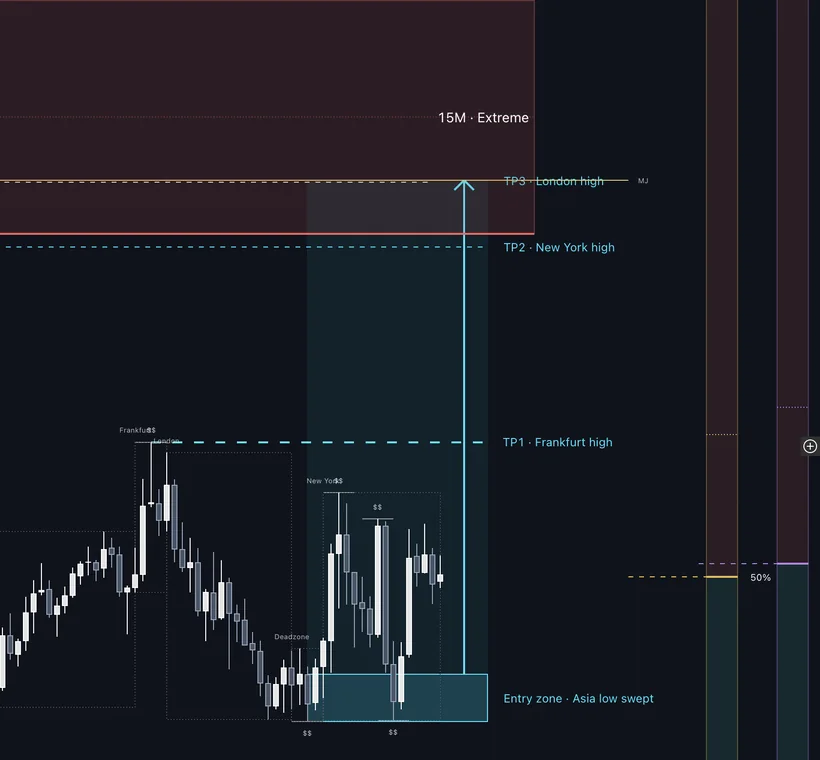
Most traders only saw candles.
Same chart, read in order: structure, expectation, sessions, confirmation, target.
Layer off. Just candles. Tap the switch.
Scroll: turn the Layer on one module at a time, then replay what price did next.
↓
Higher timeframe → mid timeframe → entry timeframe. The set depends on the asset.
Pips, ticks, points or $. Same read.
Built and tested on
Early access goes to the waitlist first.
Free. No spam. Unsubscribe anytime.
Asia, Frankfurt, London, Deadzone, New York.
Decisional, Extreme, Imbalance, Flip.
Higher timeframe to entry timeframe, in one read.
Turn modules on and off. Press play and watch the read build candle by candle.
Historical example. Simplified web demo of the Layer's read. Not a trade, not a signal.
Three timeframes. Each one has a single job.
The higher timeframe sets the direction and the context, and marks the levels worth working from. Each asset gets its own market structure: every market has its own volatility and its own way of moving.
With direction set, the mid timeframe frames the trade: which session it's in, which session liquidity is still to be taken, whether structure lines up with the higher timeframe, and the directional targets, anchored on levels defined by fixed rules built on years of historical data.
Direction, context and levels are already set by the engine. Now there's one thing left: the confirmation, highlighted by the indicator.
Built by Ilias
Private until now. The read I built for my own trading and taught by hand to hundreds of students. This is the first time it leaves my screen.
Closed beta with students of the course.
Public launch. The waitlist hears first.
Nexus Layer opens to the public in early 2027. The waitlist hears first and sees the price first.
Free. No spam. Unsubscribe anytime.
A limited version of the Nexus Layer read, free every morning before the session, so anyone can check it against the market.
Analysis, not signals. You decide.
Join The Lab — freeFree on Telegram. Leave anytime.
No. Nexus Layer is an indicator on your own chart. It draws the read: direction, entry zone, targets and where the read is wrong. It sends no calls to copy and never trades for you. You decide.
Built and tested on EURUSD, GBPUSD, AUDUSD, XAUUSD, NAS100 and US500. The set of timeframes depends on the asset: each one is read on its own volatility.
Access when it opens, before the public, and the price before anyone else. One email at launch and a few updates before. Unsubscribe anytime.
Pricing is announced to the waitlist first.
Two quick questions, optional. They help us build it for you.
What do you trade most?
How long have you been trading?
While you wait: The Lab, free